Printed maps are a very useful means to convey detailed information. However, a new map needs to be printed whenever information changes. Computer-based maps on a screen provide one alternative - they can change dynamically to represent a changing situation - but they're not as easy to use.
Now, University of Cambridge researchers Dr. Tom Drummond, Dr. Gerhard Reitmayr and Ethan Eade have developed a system that combines the benefits of printed maps with those of computer based dynamic maps by allowing printed maps to be augmented with digital graphical information.
The team's dynamic paper map system comprises a camera and a projector looking down at the paper map from above. The system interactively tracks the map using the live video stream captured by the camera. Once the locations of the maps are known, the projector displays extra information directly onto them.

The system also tracks user interface devices which can be placed on the map and which enable access to information that is linked to locations on the map.
A simple physical prop, for example a piece of white card, can become a selection tool and projection surface at the same time. Images referenced by the location pointed at can be displayed on the white card.
The system also lets the user interact with real and virtual assets on the map using devices such as a personal digital assistant (PDA).
To demonstrate possible uses of the augmented mapping system, Dr. Drummond and his team have implemented a flood control application for the city of Cambridge.
The River Cam runs close to the city centre of Cambridge and can flood surrounding areas. In the event of real flood, the water line would need to be monitored, threatened areas identified and response units managed. And an augmented map would provide the ideal way to present and control all the relevant information in one place.

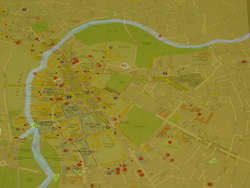
The images above show a Cambridge flood scenario. The left column shows the normal state, while the right column shows the extension during a flood.
A map of the area is augmented with an overlaid area representing the flooded land at a certain water level. The overlay changes dynamically with the water level. Certain endangered locations are highlighted in red with an animated texture when the water level reaches a critical level.
Other information sources can be included too, such as images provided by ground personnel at various locations. Green icons on the map represent the locations and directions of these images. Purple circles represent those places where website information is available about the locations, and placing the PDA next to them presents the associated website.
An emergency unit represented as a helicopter is visible on the map as well. By placing the PDA next to it, a corresponding graphical user interface appears, presenting status information and allowing an operator to issue commands to to the unit.

In the future, Dr. Drummond and his team intend to tweak the system to make it both easy to deploy as well as mobile.


Project to investigate hybrid approach to titanium manufacturing
What is this a hybrid of? Superplastic forming tends to be performed slowly as otherwise the behaviour is the hot creep that typifies hot...