In anticipation of development planned for the historic City of London, the city council in recent years commissioned a 3-dimensional virtual model of the area to help city planners understand the affect new structures might have there. One of the model’s early uses was to ensure sight lines to St. Paul’s Cathedral and other historic structures would be preserved, which has for years been the guiding principle for building construction in the City of London.
RWDI was retained to help the council and city planners extend the virtual model’s usefulness. The application of sophisticated modelling and analysis techniques is enabling city planners to consider far more than just sight lines as they lay out the future of the City.
Making the most of limited space
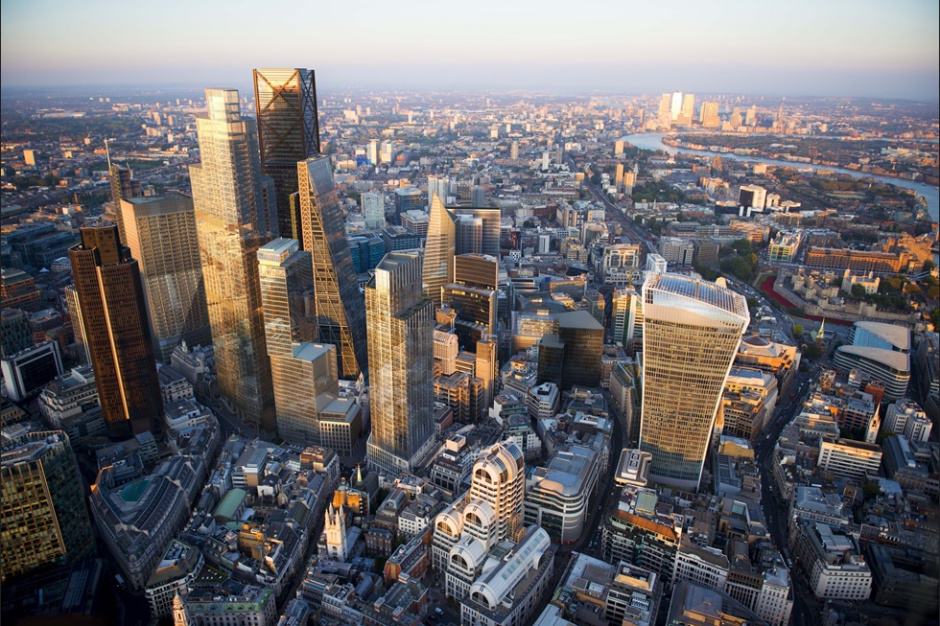
Also known as the Square Mile, the City of London on the north bank of the Thames River has been a leading global financial centre for more than a thousand years. To accommodate the need for more office space in this geographically limited area, city planners in the 1980s set aside an area known as the Eastern Cluster for the development of tall towers. Since then, the Eastern Cluster has become home to a number of skyscrapers.
A 34-story high-rise at 20 Fenchurch Street, completed in 2014, highlighted the need for greater oversight. Located within the City but outside the existing Eastern Cluster, this structure, which is also known as the Walkie-Talkie, replaced a 25-story building from 1968 that predated the Eastern Cluster. As the Walkie-Talkie neared completion, it resulted in unexpected and quite dramatic wind and solar effects on the local microclimate. This led city planners to seek insight into the potential effects of other proposed structures in hopes of avoiding this type of adverse effect from future development.
Adding to planners’ concerns is the fact that the City of London is in the middle of a culture shift. Many people are using outdoor spaces much more than they have before. Traditionally, this part of London has been filled with historic buildings on sites that for a thousand years were the trading center of London, with guild halls, coin exchangers, and the like. In this historic part of London, people traditionally went into their offices early in the day and never came out until 5 or 6 o’clock. Now, however, everybody seems to want to be outside most of the time, and usable outdoor space has become extremely valuable for residents of the City of London. The difficulty arises in considering the potential effect that future development might have on these microclimates. Wind effects are perhaps the most obvious concern.
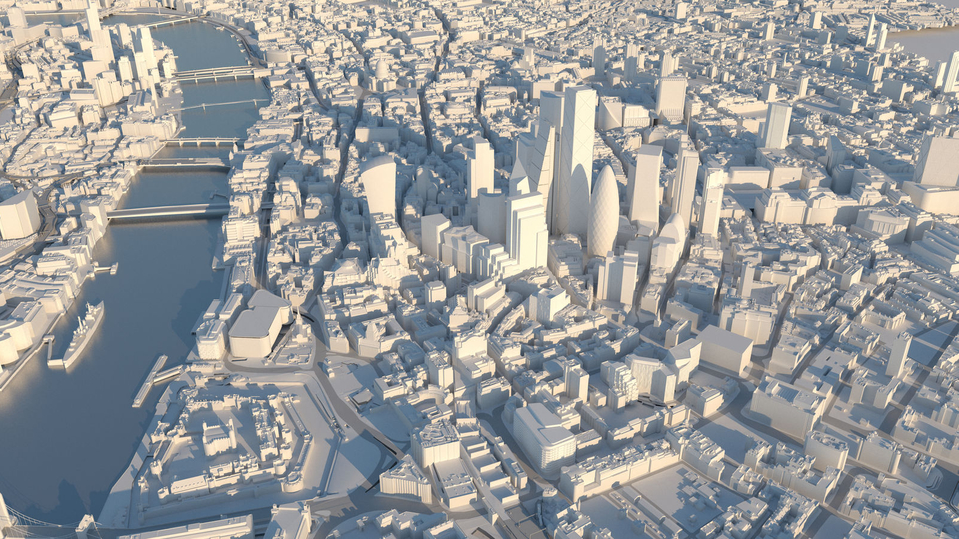
Based on the virtual model of the area that the City had already commissioned, RWDI used computational fluid dynamics (CFD) to demonstrate how modelling could provide comprehensive information about the wind effects that could be expected from the new buildings being proposed or constructed. In addition, we built a physical scale model of the City to test in our wind tunnel, using technology refined over the past 50 years that provides excellent location-specific design data. By overlaying the CFD analysis and wind tunnel test results, we demonstrated to city planners the advantage of applying both types of analytical methods. Whereas computer modelling provides information about the wind effects everywhere throughout the model, such models do not simulate turbulence—the blustery gusts of wind—as accurately as wind tunnel testing does. In the wind tunnel, however, data is only collected where sensors have been placed. The information the sensors collect is more refined, giving a much more complete picture of local effects, but sensor locations must be carefully planned.
More lessons learned, and to learn
One interesting thing that came out of the exercise of working together with the virtual and wind tunnel models was a better understanding of how clustered buildings change the microclimate, producing what we dubbed the “huddled penguins effect.”
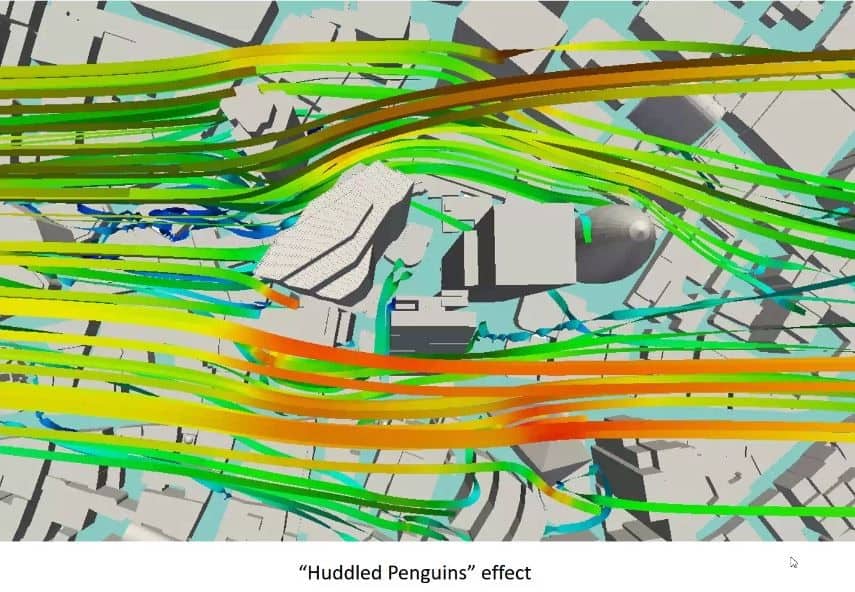
Penguins typically huddle together to protect each other against the extreme cold of the polar regions. While the penguins on the outer edge of the cluster take the brunt of the strong, cold winds, the penguins on the inside are nice and cozy. Our analysis of clustered buildings in the City of London showed that the same concept applies to clusters of buildings. Those on the outer edge of the cluster are the ones taking the brunt of the climatic conditions, while there may be a nice calm environment in the middle.
Why is the huddled penguins effect significant with respect to the City of London? By looking at future growth with this perspective, planners realised that as this part of London keeps growing, the new buildings on the outer edges are going to be subject to some very strong wind conditions. At the same time, new developments within the sheltered part, the inner part of the cluster, are going to be in relative calm.
This new insight came just as the city planners approved plans for a 300m tall building, which fortunately was right in a sheltered spot. Had that building been located anywhere else, it would have caused a huge local wind problem. But in its planned location, it is protected by all of its neighbours.
Having shown how wind problems could be addressed going forward, we were asked to investigate concerns about sunlight, or daylighting, to further leverage the existing virtual model.
Anticipating daylighting concerns
For the daylighting study, we modelled the entire Square Mile area to show planners the current conditions. As one would expect, some areas are very sunny while other areas get very little sun. And around tall buildings, there are places where there is almost no sun at all.
In London a law dating back hundreds of years states that any new building shall not reduce the sunlight on neighboring residential buildings. By using the 3D model to look at all the neighbouring residential buildings in a particular area, we were able to calculate how high a building could be before it started to shade neighboring residential buildings. With that information, we could map areas where if a developer were to go beyond a certain height, the new structure would start to overshadow some of the nearby residential buildings and likely would require payment of a hefty sum to obtain their approval. Having these insights early in the planning stage is proving to be very helpful for all involved.
We also are talking about other issues that could be managed through similar 3D modelling. For example, an air pollution map could show where the worst areas are for pollution and perhaps be used to plan future abatement scenarios. Ambient noise is another concern that could be tracked and managed with this model.
Planners have also shown great interest in incorporating pedestrian movements into the 3D model. Where do they walk through? Which streets do they use most frequently? And beyond that, this approach may offer a way to manage the safety—and comfort—of the City’s burgeoning number of bicyclists.
In a nutshell, especially as city planners consider approving more high-rise buildings, they must consider the myriad ways in which these new structures will affect public areas. This is something that now can be illustrated with this virtual model.
Enzer Ozkan is a senior consultant and principal at RWDI (Rowan Davies Williams and Irwin), a speciality consulting engineering firm, heaquarterted in Canada and with offices in the UK, India, China, Singapore and Hong Kong.
Report highlights significant impact of manufacturing on UK economy
Note to Evil Villain/Dave 2020. Thatcher was PM for _11_ years, from 1979 to 1990 so no one under the age of 34 was even born when she left office....