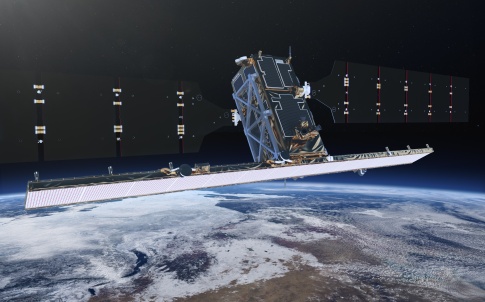
Produced from over 2.5TB of radar data acquired over two years by the Sentinel-1 satellite, part of the EU’s Copernicus programme, the map is claimed to be the first of its kind to show a detailed nationwide picture of land motion and subsidence.
The technology behind the map could help developers of energy and transport infrastructure – such as the impending HS2 project - improve their understanding of land subsidence and mitigate against the risks this poses at a far earlier stage in a project’s development.
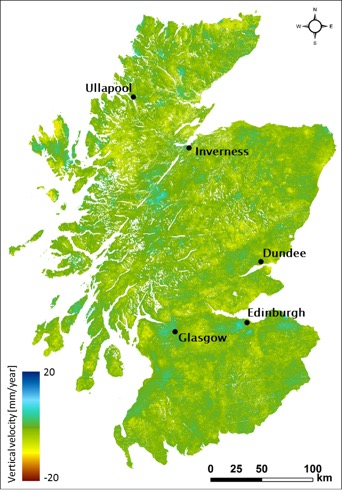
The relative land motion map of Scotland for 2015-2017. Subsidence is indicated by the red and yellow colours, blue indicates uplift, whereas green represents stable ground.
Whilst existing land-motion studies have tended to focus on urban areas, the Nottingham-developed map has also been able to look in detail at rural areas thanks to a technique known as Intermittent Small Baseline (ISBAS) analysis developed by University of Nottingham spin-out Geomatic Ventures Ltd (GVL).
“Radar’s great for looking at hard targets” explained GVL CEO and inventor of the technique Dr Andrew Sowter, “when you get a radar satellite and point it towards the ground you get these fantastic reflections from buildings. But if you start to look at rural areas you don’t see the same quality of response: grasslands and agricultural areas are constantly changing and most of the technology out there ignores the rural areas and concentrates on mapping urban areas.”
However, by piggybacking on to the Sentinel 1 mission, Sowter said it has been possible to acquire such a volume of data that changes in the rural landscape can be observed. “What we’ve recognised is that we do get good responses over the rural areas sometimes and if we have lots of measurements we can filter out the good measurements from the bad measurement using our technique," he said.
The map was created as part of a University of Nottingham research project aimed at illustrating the problems facing governments when regulating onshore oil and gas production and storage in a modern landscape influenced by industrial and land management practices.
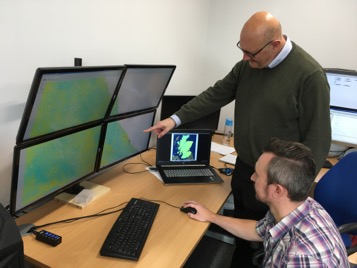
Dr Stephen Grebby of the University of Nottingham (seated) and Dr Andy Sowter of GVL (standing) discussing the relative land motion map of Scotland.
For instance, there is a perceived threat of subsidence and a potential risk of earth tremors related to fracking for shale gas. Although recently banned in Scotland, maps like this can help to screen locations to inform government regulators whether fracking can be reasonably monitored and deployed safely in other parts of the UK and around the world.
Commenting on the significance of the study Dr Stephen Grebby, Assistant Professor in Earth Observation at Nottingham said: "Tracking ground motion is also important for a wide range of other applications such as monitoring infrastructure, and this is not just limited to Scotland. For example, our wide-area monitoring technique could be used to help identify and monitor ground instability issues along the whole stretch of the proposed HS2 route. This would provide information that could ultimately influence the plans for the final route for Phase 2 of HS2, or at least highlight existing ground instability issues that may need to be addressed during construction of the network."
As well as working on a number of ongoing research projects with Nottingham University, Sowter is also exploring commercial applications for the technology, including two separate projects with Network Rail. “They’ve been looking at technologies that view deformation along their track,” he said, “but they’ve never actually been able to consider deformation that’s near the track. For instance, if there’s a coal mining area that’s collapsing within a few hundred metres of the track they‘ve not been able to see it before. Using this technology…they can start to predict whether there will be a collapse.”
Meanwhile, the current study showed that large areas of Scotland’s vast lowland and highland peatland areas are dominated by subsidence. This is notable as collapsing peatlands are a significant source of greenhouse gases. According to the Scottish Natural Heritage, the carbon stored in Scotland’s soils is equivalent to over 180 years of greenhouse gas emissions from Scotland at current emission rates.
"If Scotland is to reach its climate change targets, which are currently under scrutiny by the UK Committee on Climate Change, land motion maps like this can provide vital evidence on the health of peatlands and with regular monitoring, the beneficial effect of peatland restoration towards improving the carbon balance," said Sowter.


JLR teams with Allye Energy on portable battery storage
This illustrates the lengths required to operate electric vehicles in some circumstances. It is just as well few electric Range Rovers will go off...