
Does anyone remember the balance of payments? It captures the value of flows of income and goods between the UK and the rest of the world. It formed a cornerstone of political and economic debate in the UK back in the 1980s, when people were concerned that a net outflow for the UK would be bad for the economic sustainability and general health of the economy.
I recently delivered a finance course for engineering undergraduates and one of the subjects that seemed to resonate with the audience was this idea of global flows and uses of capital.
A quick look at Google’s nifty Ngram viewer, which charts the frequency of any word or phrase found in literature sources between 1800 and 2012, shows that the use of the term “balance of payments” peaked in 1966 and then dropped off a cliff in about 1983.
Meanwhile, the UK’s current balance of payments (also called current account balance) has reached a record deficit of 6% of gross domestic product (GDP) in Q3 2014, and a net outflow for the whole of 2014 of £98bn.
Some economists argue that a negative balance of payments is not a concern, at least unless it lasts many decades, but undoubtedly all that money is leaving the country. So where is it going, and who is likely to be in a position to reinvest and prosper from this flow?
There are a couple of interesting places to look for an answer. Two league tables in particular offer some insights about where capital might be accumulating in the world.
The first is the list of the world’s top exchanges. This shows the largest stock exchanges in the world by total capitalisation.
It’s good to see London is number 3, and highlights its role as the principal financial centre in Europe. However, in a way I feel this represents the old world order of things, the power base from a couple of decades ago. Crucially, the table doesn’t indicate who holds the funds, or in this case the shares, and hence who makes the key decisions.
A second more interesting table is the world’s top sovereign wealth funds. Sovereign wealth funds are entities that manage the national savings of a country specifically for the purposes of investment.
I think this is more representative of where we are today in terms of accumulated capital and thereby financially driven influence.
As you might expect China is number 1. The ranking calls China a non commodity economy. In China’s case, its money has come from becoming the manufacturer of the world. Numbers 2, 3, 4 and 5 are oil based economies. They are the lucky recipients of the fortunes from a valuable, if non sustainable, resource.
Number 6 is Singapore. A happy economic story, Singapore with a population of only 5.5m is one of the 4 Asian Tigers (along with Hong Kong, South Korea, and Taiwan) and has accumulated this wealth through the prowess of its economy.
Hong Kong itself is similar at number 7. Then number 8 is Canada, which has a mixture of non commodity and oil based enterprise. (Interestingly, the USA is down at number 12.)
As well as interesting in its own right, I believe the table underlines the fact that, even in the face of vast oil fortunes, technology investment and manufacturing are some of the best ways to generate economic wealth.
R&D is of course key in developing a knowledge based economy and the UK’s Gross R&D expenditure as a % of GDP was 1.7% in 2012 (an unchanged percentage from 2007). This makes the UK about average, just slightly below the EU28 average of 2.1%.
However, the UK is supreme in punching far above its weight in the amount of R&D produced at a given level of investment, as this comparison of citation outcomes from Higher Education R&D (HERD) shows. Indeed, I wonder why we don’t do more R&D given that we are so good at it.
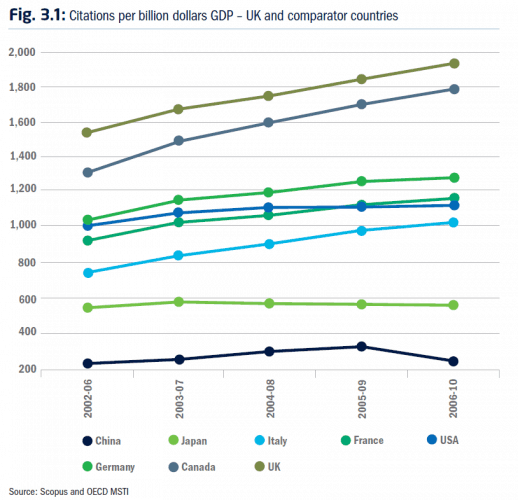
Source: EngineeringUK State of Engineering 2013 fig 3.2 p.30
So what exciting opportunity does this represent? We’ve all heard the story that the UK is almost unmatched in its abilities to generate good ideas - indeed the chart above highlights this - but lamentably poor at commercialising these ideas and bringing new products or services to market.
My personal opinion is that the current growing craze for entrepreneurship offers an obvious way to remedy this disconnect. Unlike large companies, small companies can be more agile and are better able to refine their propositions and help define new technology markets.
To quote the OECD “… Whilst new innovative firms are knowledge-intensive and high-risk, [they] have high ambitions and can have a disproportionate effect on innovation and job creation. SMEs may have a more modest economic impact individually, but collectively they make a substantial difference. Evidence for various countries suggests that 4-6% of high-growth firms may create half to three-quarters of all new jobs …”
With the right inspiration, a tool box of modern entrepreneurial commercial skills and access to capital (in other words, the right support eco system) the upcoming wave of young (or not so young) science and engineering entrepreneurs may hold the key to the future.


Red Bull makes hydrogen fuel cell play with AVL
Formula 1 is an anachronistic anomaly where its only cutting edge is in engine development. The rules prohibit any real innovation and there would be...