Leicester University physicists used their air quality measuring spectrometer to produce “heatmap” style images of pollution levels in Leicester as part of the Airborne Air Quality Mapper (AAQM) project.
The images show how levels of nitrogen dioxide (NO2) vary around the city, revealing the differences in air quality between green, wooded areas and busy road junctions and areas of industry.
The university believes the results could help draw attention to polluted areas and help inform future environmental planning decisions.
NO2 comes primarily from traffic emissions in urban environments and can cause health problems including increased risk of respiratory illnesses such as heart attacks and bronchitis.
The European Commission is pressing the UK government to find a solution to NO2 in large cities across the country. Large fines may be imposed and new legislation allows these to be passeddown to Councils which don’t take urgent action to improve their air quality.
While Leicester is not among the worst-affected cities, the city’s council is said to be in the forefront of developing local and national solutions to this problem through work with Leicester University and DEFRA. The aim is to develop smart traffic management schemes and reduce vehicle emissions.
As part of the process of developing solutions to this national problem, scientists at the University’s Earth Observation Science group, based in the Space Research Centre, have used their Compact Air Quality Spectrometer (CompAQS) device to map air quality around the city.
The device monitors visible light, and measures how much light is lost at specific wavelengths absorbed by NO2. Development of the instrument took place with Surrey Satellite Technology and was funded by the UK’s Centre for Earth Observation Instrumentation and the Natural Environment Research Council.
The team has previously used the device as part of the CityScan project – involving several spectrometers placed on tall buildings, which are being used to build a 3D map of pollution across a city.
The team has now adapted the technology to be used in aircraft and in February scientists mounted their spectrometer to the bottom of an aerial survey plane and flew over the city.
The device gave a reading for NO2 levels between the ground and the plane, which was flying at around 900m. Each reading corresponds to an area of 6 metres by 100 metres at ground level.
They collated all the readings, and overlaid the results over Google Earth – giving a detailed map of air quality in the city and surrounding areas.
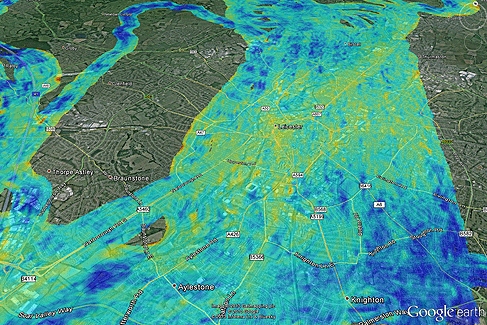
Particularly clean areas of the city – indicated by the darker blue spots on the map – include Knighton Park, Oadby Race Course and Western Park Golf Club. More polluted areas – shown in red and yellow - include Leicester Train Station, the St Nicholas Circle roundabout, and the M1 junction 21.
The images give a very useful indication of the relative air quality levels across the city – and the team are currently carrying out further research to determine the exact concentrations of NO2 present in the air for each reading.
This will reveal the approximate figures for the amount NO2 in the atmosphere, and will indicate whether there are areas where the concentration of NO2 is high enough to be of concern.
The researchers hope to carry out further flights with industrial partners Bluesky International, a UK-based specialist in aerial imaging and remote sensing data collection and processing.
In time, they hope to be able to adapt the technology to use on spacecraft in order to monitor pollution levels across the whole planet.
Project leader Dr Roland Leigh, of the Earth Observation Science group, said, ‘This is the first time in the UK anyone has been able to use airborne devices to map pollution levels across whole cities. This information really helps us understand the sources of pollution within cities, and the human exposure downwind.’


Poll: Should the UK’s railways be renationalised?
I think that a network inclusive of the vehicles on it would make sense. However it remains to be seen if there is any plan for it to be for the...