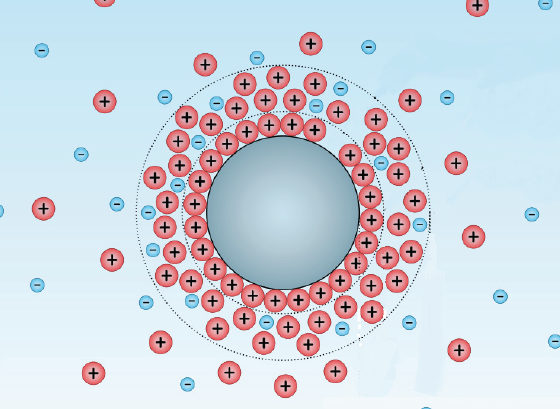
Zeta-potential measurements are a convenient way to determine the stability of colloids against aggregation. In order for colloidal particles to remain in suspension, they must repel each other, or else they will tend to cluster together and undergo sedimentation or coagulation. For particles to repel each other, they need to have a certain surface charge, which is reflected in their zeta potential.
Particles with a high zeta potential (positive or negative) will produce a well-dispersed suspension that is stable against sedimentation. Particles with a low zeta-potential, on the other hand, will tend to aggregate and the suspension will be unstable. Thus, zeta potential is an important factor for the preparation or destruction of colloidal dispersions across diverse industries, such as biomedical technology, pharmaceuticals and polymers, as well as waste-water treatment.
Zeta potential can be conveniently obtained by using electrophoretic light scattering (ELS), in which the electrophoretic mobility is measured and then used to calculate the zeta potential. In a typical optical configuration, the light scattered by the particles is detected in the forward angle (15°), which means the laser beam must travel through the whole sample. This is problematic for concentrated samples, because the light is likely to be scattered by more than one particle on its path through the sample. As calculation of the zeta potential relies on the light only being scattered once, such multiple scattering leads to an inaccurate zeta potential. Therefore, zeta potential cannot usually be accurately measured on turbid or highly concentrated samples.
In this application report from Anton Paar, zeta-potential measurements were carried out on two different turbid and highly concentrated samples using two different instruments.
All measurements were performed at 25 °C and three consecutive measurements were performed at each concentration to check for repeatability.
Click on the link above to download the Application Report and to learn about the results of this experiment.


Water Sector Talent Exodus Could Cripple The Sector
Maybe if things are essential for the running of a country and we want to pay a fair price we should be running these utilities on a not for profit...