
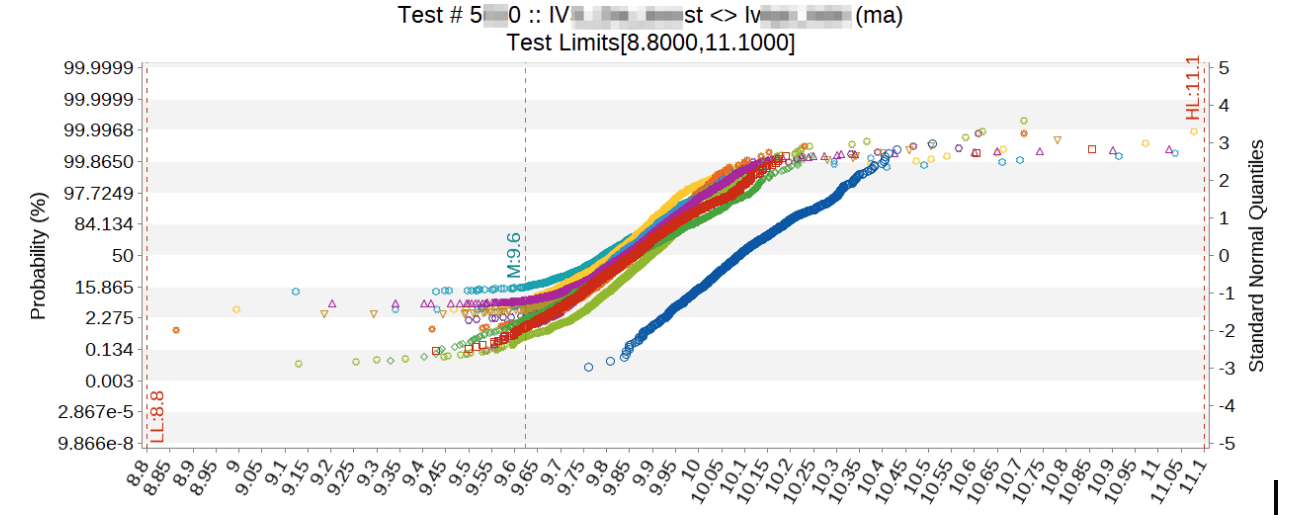
A customer recently wanted to analyze the parametric variation of a key parameter measured at final test at the end of manufacturing. How does that parameter vary across the lots made in 2019? How hard can it be? Actually, it’s very easy with a good software system and the plot is really very satisfying. But what’s going on behind the scenes?


Virgin Atlantic’s Flight100 saved 95 tonnes of CO2 in first SAF flight
LOL a time-honoured unit of volume measurement,, just as large <i>AREAS</i> are expressed as multiples of the size of Wales … or renewable energy...